Energy Industry ux Research
Who is using our suite of apps?
ROLE: Lead Researcher
PROJECT TYPE: Ethnographic Study
RESEARCH: Qualitative, Foundational
TIME FRAME: 3 weeks
Project Summary
While contracting with a large oil and gas company, I was engaged by an internal strategy team who was considering overhauling their current suite of customer facing applications, but they were uncertain who exactly was using each application because the end users were multiple third party distributors’ end customers. They did not have access to the third party distributors’ customer data, so they were uncertain what types of named roles they were ultimately catering to with this particular application suite. The project team asked me to research and determine who the final end users might be and which applications each user type might be using and how often they interacted with each application in the suite. The only catch—I could talk with the distributors who were technically our direct customers but I couldn’t talk to their customers, the actual end users.
Approach
I’ll pause here, because I’m sure any other UX researchers worth their salt reading this right now are probably shaking their heads saying, “You should have fought to talk to users - it’s a basic requirement of good user research.” And I agree. In our preliminary stakeholder meetings I did my best to respectfully communicate how much value the project could gain in understanding when and why end users chose to interact with each application in the suite and that speaking to the distributors would not be the same as talking to actual end users. Unfortunately, in this case it was simply not an option. So instead of leaving this team high and dry or belaboring the point, I chose to move forward with a plan to find out as much as I could about their end users and set the team up for as much success as possible under this unusual UX research constraint.
I put together a research plan based around targeted semi-structured one-hour interviews with members of my two subject matter expert groups— the internal team members and a short list of approved distributors— to gain as many clues as possible as to who the end users might be. As I completed each distributor interview, I used snowball sampling to augment my initial distributor list. This proved to be a solid strategy and after a week of interviews I had a fair amount of data to work with. I also started to see why the team was struggling so much to identify these users. The assumed end user job titles and duties were highly inconsistent. All of these potential end users worked for different companies with different staff structures and different naming conventions. It was almost impossible to genuinely align all of those potential users into anything more than generalized buckets based on what I knew so far. So I decided to lean on the expertise of my most senior and experienced distributors to help me make collections of what might be considered “typical” roles as a starting point. I then used what data the distributors could share about which apps in the suite had been actively promoted, trained, supported, or pushed to these specific customer types to build an anecdotal web of potential usage for each of these generalized typical roles.
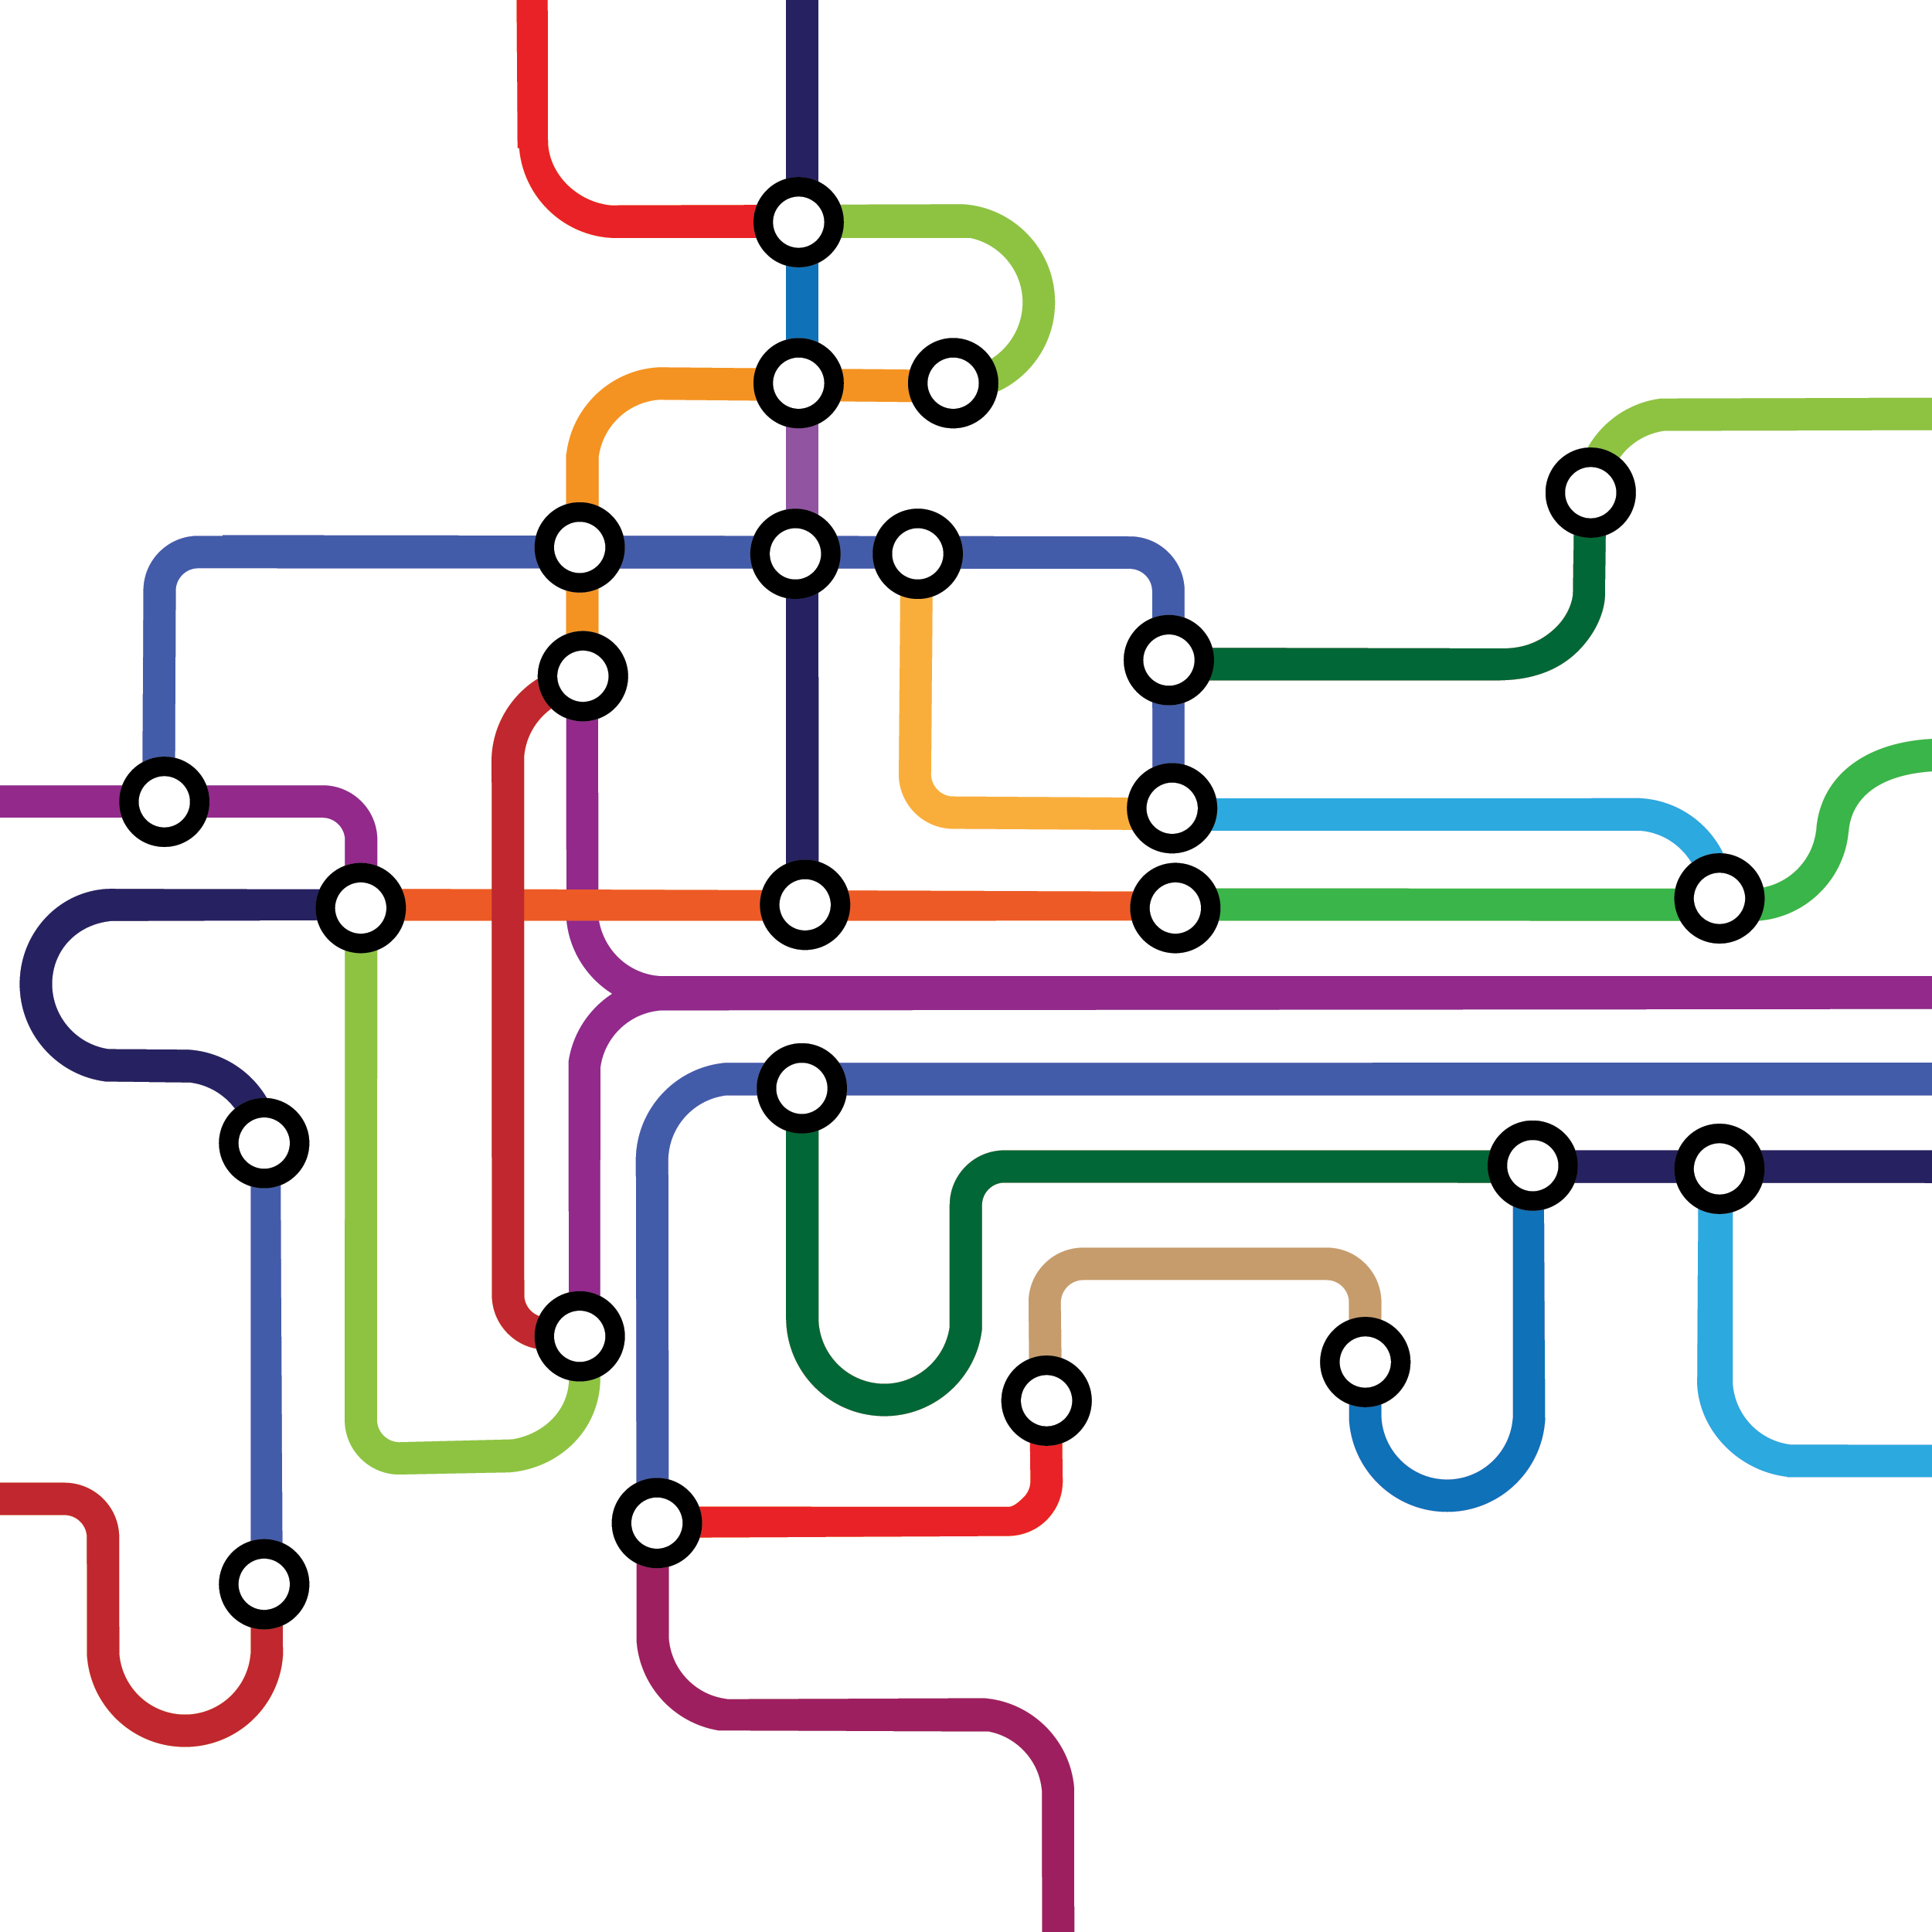
Based on these activities, I ended up with some fairly complex user/application relationships that were difficult to describe using typical charts or a written report. Instead, I designed a custom data visualization based on subway map design to explain the quantity and complexity of the relationships between each typical role and the applications in our study. I printed this annotated visual as a wall-size poster for my final deliverable and presentation. I also made sure to prominently document within this deliverable our research constraints (no users). I specifically positioned the data presented not as final data, but as preliminary research. I was worried that when the team distributed these materials to other departments, there might be an assumption that this data was safe to use as a basis for making important decisions. While it was definitely a step in the right direction, I wanted to be sure my findings would not be accidentally misrepresented.
Revised Research Questions
• What named user roles are using each application in the suite?
• How many applications in the suite might each user role interact with on a daily/weekly/monthly basis?
• How many applications within the suite are necessary for each user role to do his or her job?
• Are there other apps (unknown or overlapping in functionality) that these user roles are also required to use frequently?
Project Breakdown
• 1 Lead researcher
• ~8 Individual interviews with distributors - 1 hr each
• ~3 Weeks research and design activities
Final deliverables took the form of a verbal presentation of the large wall-size poster referenced above followed by a moderated group discussion and a smaller digital PDF version to be distributed at the team’s discretion.
Project Timeline
Week 1 - Background and secondary research
Week 2 - Phone interviews with Distributor subject matter experts
Week 3 - Design custom data visualization in lieu of report out presentation
Individual Responsibilities
• Create and maintain the research plan
• Communicate with stakeholders
• Subject matter expert recruitment and interview scheduling
• Managing data privacy practices
• Writing interview scripts
• Managing, analyzing, synthesizing all collected data
• Final deliverables design and presentation
Outcomes
The end result of my research effort was predictably skewed; my findings were conjecture based and did not reflect the actions or opinions of actual end users. However, despite all this, it was not a failure because my work ended up being a starting point for true user-based research work to begin. It turned out by the end of my final deliverable presentation and the lively team discussion that followed, I had convinced the team of the value of UX. Not only that, I had given them the information they needed to make a case to upper management for why they needed access to those end users. Shortly after I wrapped up this project, we had a reorg and I was moved to a different part of the company, but I heard through the grapevine that they ended up pursuing my recommendations to speak with end users and continue the work I had begun. The data visualization I created also got circulated around the company several times over the following year and I was always happy to witness the pleasantly surprised responses from non UX folks when they saw solid proof that research didn’t have to take the form of a traditional PowerPoint presentation.
Key Project Takeaways
It’s OK to stand up for doing UX research the right way. This project was by far the one I was most conflicted about for a very long time. It was one of my first UX research projects and I had pressure to do the work and pretend like it didn’t matter that we were not speaking to actual end users, but it did. I decided to stay true to myself both in my meetings with the key stakeholders where I was honest about the potential inaccuracy of the data and also in how I presented that final work. What a relief it was to discover they were open to listening to me. I’m not sure they would have been so convinced on the value and potential efficacy of UX research work had I just “done the job.”